2.1 Solution Curves Without a Solution: Class Notes
2.1a
Definition
If is a differentiable function, then gives the slope of a tangent line at a point. We can learn about a DE using segments of tangent lines, called lineal elements. The collection of these lineal elements is a direction field or slope field.
Example
Sketch an approximate solution curve that passes through each of the indicated points
a) b) c) d)
Start at each given point and follow the lineal elements in both directions: the curve runs parallel to the nearby segments everywhere. Each curve below is drawn in the same color as its initial condition.
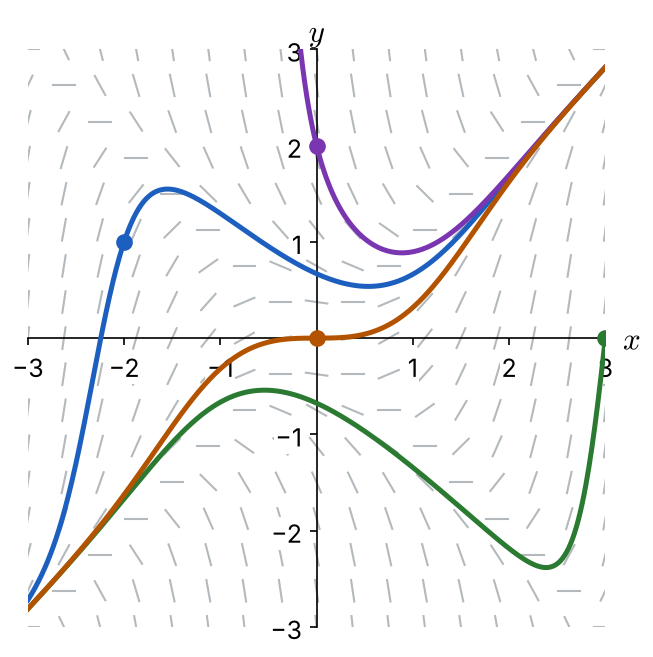
Direction field on , with four solution curves. a) Through : rises steeply from the lower left, peaks near , dips to a low point near , then climbs along the line to the upper right. b) Through : comes up from the lower left to a high point near , falls to a low point near , then shoots up steeply to . c) Through : comes down steeply from the top just left of the -axis, reaches a low point near , then climbs along . d) Through : rises from the lower left along , levels off with a horizontal tangent at the origin, then climbs along to the upper right.
Example
Use computer software to obtain a direction field for the differential equation. Sketch an approximate solution curve passing through each of the given points.
a) b)
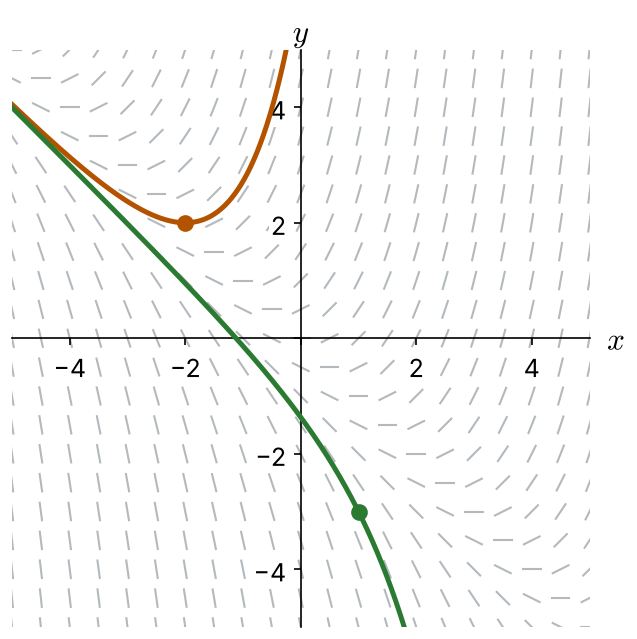
Direction field on , with two solution curves. a) Through : a U-shaped curve whose lowest point is itself; it rises to the left along the line and rises steeply to the right. b) Through : decreases everywhere, following the line on the left and dropping steeply to the right.
2.1b
Definition
A DE in which the independent variable does not appear explicitly is an autonomous differential equation. A first-order autonomous DE has the form .
For example, is autonomous: the independent variable does not appear on the right side.
Definition
A number is a critical point of an autonomous DE if . A critical point is also known as an equilibrium point or stationary point. A constant solution of an autonomous DE is an equilibrium solution.
In the example above, when , so is a critical point and is an equilibrium solution.
Example
Consider the autonomous first-order differential equation and the initial condition . Sketch the graph of a typical solution when has the given values.
a) b) c) d)
Solution
Find the critical points by setting :
The critical points are , , and . They give the equilibrium solutions , , and (horizontal lines). Next, find the sign of between and beyond the critical points. The factor is never negative, so the sign comes from :
A solution can never cross an equilibrium solution, so each typical solution stays between the same pair of horizontal lines (or beyond the outer one) and levels off toward them:
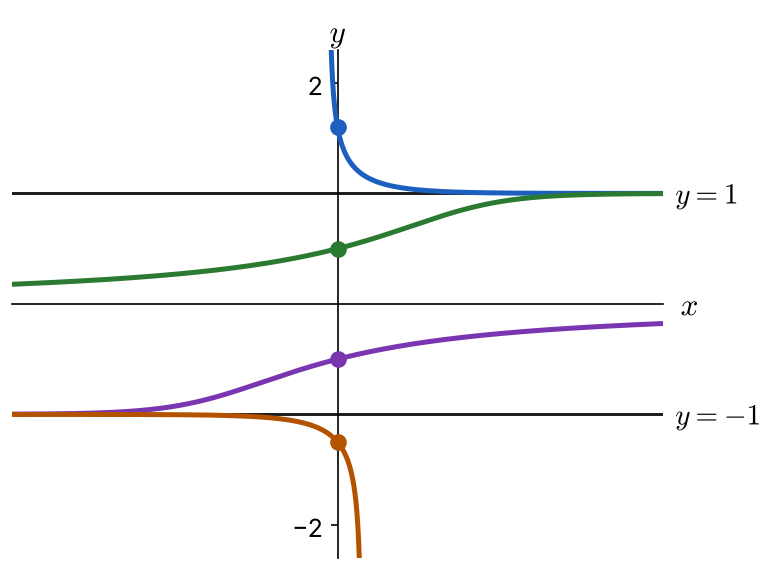
Equilibrium solutions , (the -axis), and . a) For , the curve decreases toward as and rises steeply to the left. b) For , the curve increases from near on the left toward on the right. c) For , the curve increases from near on the left toward on the right. d) For , the curve decreases from near on the left and drops steeply downward to the right.
This information can be collapsed into a one-dimensional graph, called a phase portrait: a vertical -axis with the critical points marked and arrows showing whether solutions increase (up) or decrease (down) in each region.
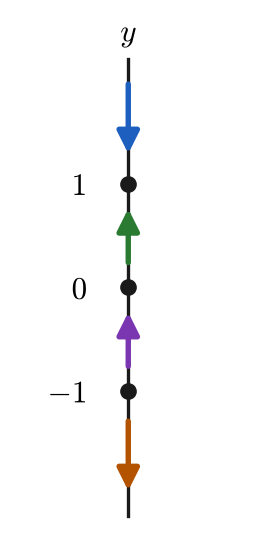
Vertical -axis with dots at , , and . Arrows: pointing down above ; pointing up between and ; pointing up between and ; pointing down below .
Reading the arrows near each critical point:
• is an attractor (asymptotically stable): the arrows on both sides point toward it.
• is semi-stable: the arrows on both sides point up, toward it from below and away from it above.
• is a repeller (unstable): the arrows on both sides point away from it.